 Message Board")


SA: Bears Beware - Rare Bullish Signal
Jan 20, 2023 19:17:02 GMT
miamianne67 and highskier like this
Post by icemandios on Jan 20, 2023 19:17:02 GMT
Written by

Lawrence Fuller
Bears Beware Of Another Extremely Bullish Indicator
Jan. 20, 2023 9:12 AM ETIWM, RSP3 Comments
Summary
The market is consolidating gains from the first two weeks of the year in a pause to refresh.
Further confirmation that disinflation is entrenched should come next week.
One of the most powerful combinations of breadth indicators has triggered a buy signal with a stunningly bullish precedent.
This idea was discussed in more depth with members of my private investing community, The Portfolio Architect. Learn More »
Bull market, Financial and business concept

phive2015
Another down day for stocks cut what was a year-to-date gain of 4.2% for the S&P 500 nearly in half to 2.4%, but the stock market does not move in a straight line. We were bound to take a breather, and investors were looking for an excuse to take profits. The same excuse continues rearing its ugly head - fear that the Fed will keep tightening monetary policy, despite evidence of disinflation, and cause a recession. Fed officials fan those flames with the sole intention of keeping stock prices in check. Therefore, until the balance of economic data clearly shows that the peak in short-term interest rates is behind us and the target of a 2-3% rate of inflation is within reach, bulls and bears will play tug of war with stock prices. Still, I see the trend being up.
market averages
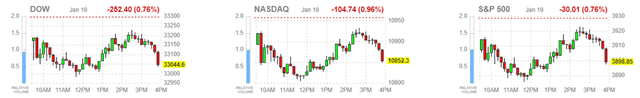
Finviz
There is no question in my mind now that the rate of inflation is falling faster than most expect, and next week's PMI report from S&P Global should show a continued collapse in input costs for both manufacturing and service sectors. It does not take a PhD to look at the chart below and see where the rate of inflation is headed based on the correlation between input prices and consumer prices. This is why the stock market has rallied over the past three months from the bottom up and over the past seven if we look at small caps.
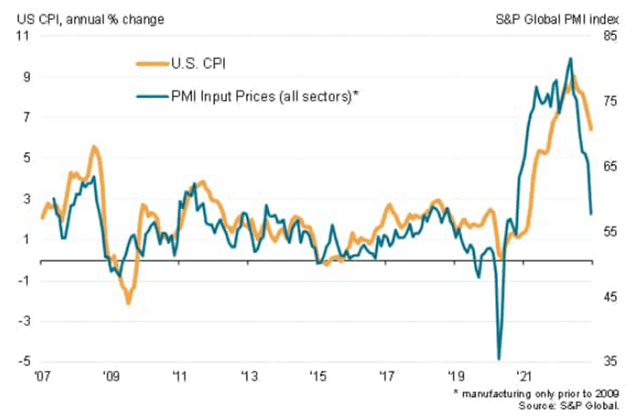
S&P Global
Regardless, I think Fed officials are intentionally ignoring this progress in hopes of reining in unwanted enthusiasm for risk assets. I think I would be doing the same thing if I had been assigned the mission of reversing a surge in inflation to a 40-year high in record time. I would not want anything to stimulate demand for goods or services (financial wealth) in the process. The Fed will likely follow the market's cue at month end and raise rates another 25 basis points, but we should have overwhelming evidence before its next meeting in March that inflation has been contained and that the rate cycle has come to an end. Fed officials will most assuredly not let up with hawkish rhetoric until well after the peak in short-term rates is in. That should provide the most ardent bears with their last few breaths of hope that new lows in the major market averages are still a possibility, but to no avail in my opinion. I think the market is in the process of discounting this now.
I spent a lot of time talking about the extraordinary improvement in breadth for the market this week. We can see it in the outperformance of the Russell 2000 index (IWM) and the equal-weighting S&P 500 index (RSP). It has been so strong that it triggered a Breakaway Momentum buy signal, which is an indicator crafted by esteemed technician Walter Deemer. This is so rare because it requires the ratio of advancing to declining stocks on the NYSE to exceed 1.97 over a ten-day period. It has only happened 24 times since 1945 and last Thursday made it 25. The forward returns for the S&P 500 have been higher 96% of the time in the 6- and 12-month periods after the buy signal was triggered. The signal just got stronger.
Breakaway Momentum
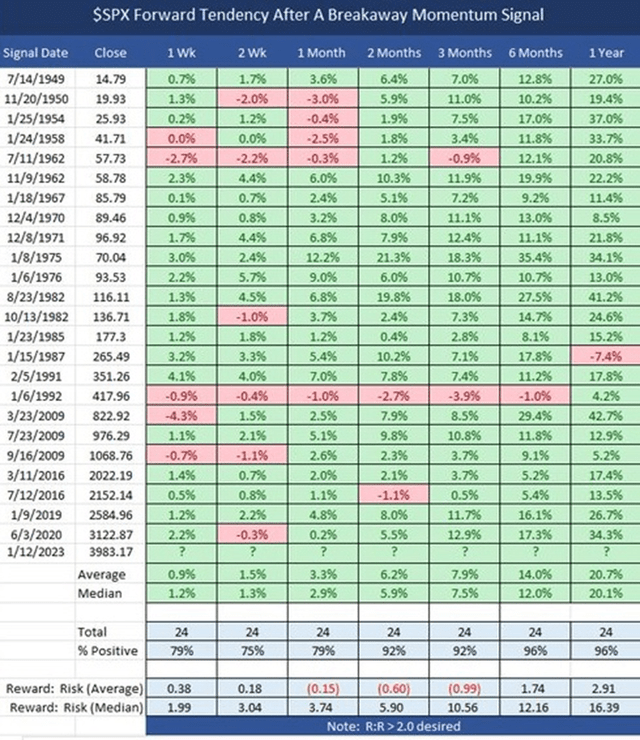
TheStreet
It turns out that two additional market breadth buy signals were triggered, using different methodologies, which have increased the historical probabilities for positive forward returns. Wayne Whaley's Advance Decline Thrust indicator and the Triple 70 thrust signal from Quantifiable Edges both gave rare buy signals last week. The data below shows the seven times that two of these three indicators were triggered going back to 1957, and the forward returns are astounding. The S&P 500 posted positive returns 100% of the time during 10 different time frames ranging from 63 to 252 days.
market breadth
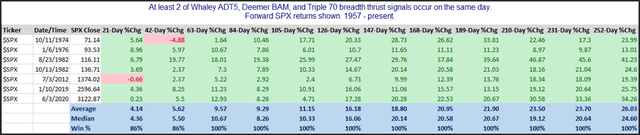
QuantifiableEdges
For the first time, all three have been triggered. I have never seen a buy signal for the market with such a compelling historical precedent. It fits nicely with my outlook for a soft landing and the birth of a new bull market, but I remain cautiously optimistic. There is no certainty when it comes to financial markets. I look forward to logging the S&P 500's performance for each time frame noted above to see if the positive returns continue.
Lots of services offer investment ideas, but few offer a comprehensive top-down investment strategy that helps you tactically shift your asset allocation between offense and defense. That is how The Portfolio Architect compliments other services that focus on the bottom-ups security analysis of REITs, CEFs, ETFs, dividend-paying stocks and other securities.
Disclosure: I/we have no stock, option or similar derivative position in any of the companies mentioned, and no plans to initiate any such positions within the next 72 hours. I wrote this article myself, and it expresses my own opinions. I am not receiving compensation for it (other than from Seeking Alpha). I have no business relationship with any company whose stock is mentioned in this article.
Additional disclosure: Lawrence Fuller is the Managing Director of Fuller Asset Management, a Registered Investment Adviser. This post is for informational purposes only. There are risks involved with investing including loss of principal. Lawrence Fuller makes no explicit or implicit guarantee with respect to performance or the outcome of any investment or projections made by him or Fuller Asset Management. There is no guarantee that the goals of the strategies discussed by will be met. Information or opinions expressed may change without notice, and should not be considered recommendations to buy or sell any particular security.
Lawrence Fuller
Bears Beware Of Another Extremely Bullish Indicator
Jan. 20, 2023 9:12 AM ETIWM, RSP3 Comments
Summary
The market is consolidating gains from the first two weeks of the year in a pause to refresh.
Further confirmation that disinflation is entrenched should come next week.
One of the most powerful combinations of breadth indicators has triggered a buy signal with a stunningly bullish precedent.
This idea was discussed in more depth with members of my private investing community, The Portfolio Architect. Learn More »
Bull market, Financial and business concept
phive2015
Another down day for stocks cut what was a year-to-date gain of 4.2% for the S&P 500 nearly in half to 2.4%, but the stock market does not move in a straight line. We were bound to take a breather, and investors were looking for an excuse to take profits. The same excuse continues rearing its ugly head - fear that the Fed will keep tightening monetary policy, despite evidence of disinflation, and cause a recession. Fed officials fan those flames with the sole intention of keeping stock prices in check. Therefore, until the balance of economic data clearly shows that the peak in short-term interest rates is behind us and the target of a 2-3% rate of inflation is within reach, bulls and bears will play tug of war with stock prices. Still, I see the trend being up.
market averages
Finviz
There is no question in my mind now that the rate of inflation is falling faster than most expect, and next week's PMI report from S&P Global should show a continued collapse in input costs for both manufacturing and service sectors. It does not take a PhD to look at the chart below and see where the rate of inflation is headed based on the correlation between input prices and consumer prices. This is why the stock market has rallied over the past three months from the bottom up and over the past seven if we look at small caps.
S&P Global
Regardless, I think Fed officials are intentionally ignoring this progress in hopes of reining in unwanted enthusiasm for risk assets. I think I would be doing the same thing if I had been assigned the mission of reversing a surge in inflation to a 40-year high in record time. I would not want anything to stimulate demand for goods or services (financial wealth) in the process. The Fed will likely follow the market's cue at month end and raise rates another 25 basis points, but we should have overwhelming evidence before its next meeting in March that inflation has been contained and that the rate cycle has come to an end. Fed officials will most assuredly not let up with hawkish rhetoric until well after the peak in short-term rates is in. That should provide the most ardent bears with their last few breaths of hope that new lows in the major market averages are still a possibility, but to no avail in my opinion. I think the market is in the process of discounting this now.
I spent a lot of time talking about the extraordinary improvement in breadth for the market this week. We can see it in the outperformance of the Russell 2000 index (IWM) and the equal-weighting S&P 500 index (RSP). It has been so strong that it triggered a Breakaway Momentum buy signal, which is an indicator crafted by esteemed technician Walter Deemer. This is so rare because it requires the ratio of advancing to declining stocks on the NYSE to exceed 1.97 over a ten-day period. It has only happened 24 times since 1945 and last Thursday made it 25. The forward returns for the S&P 500 have been higher 96% of the time in the 6- and 12-month periods after the buy signal was triggered. The signal just got stronger.
Breakaway Momentum
TheStreet
It turns out that two additional market breadth buy signals were triggered, using different methodologies, which have increased the historical probabilities for positive forward returns. Wayne Whaley's Advance Decline Thrust indicator and the Triple 70 thrust signal from Quantifiable Edges both gave rare buy signals last week. The data below shows the seven times that two of these three indicators were triggered going back to 1957, and the forward returns are astounding. The S&P 500 posted positive returns 100% of the time during 10 different time frames ranging from 63 to 252 days.
market breadth
QuantifiableEdges
For the first time, all three have been triggered. I have never seen a buy signal for the market with such a compelling historical precedent. It fits nicely with my outlook for a soft landing and the birth of a new bull market, but I remain cautiously optimistic. There is no certainty when it comes to financial markets. I look forward to logging the S&P 500's performance for each time frame noted above to see if the positive returns continue.
Lots of services offer investment ideas, but few offer a comprehensive top-down investment strategy that helps you tactically shift your asset allocation between offense and defense. That is how The Portfolio Architect compliments other services that focus on the bottom-ups security analysis of REITs, CEFs, ETFs, dividend-paying stocks and other securities.
Disclosure: I/we have no stock, option or similar derivative position in any of the companies mentioned, and no plans to initiate any such positions within the next 72 hours. I wrote this article myself, and it expresses my own opinions. I am not receiving compensation for it (other than from Seeking Alpha). I have no business relationship with any company whose stock is mentioned in this article.
Additional disclosure: Lawrence Fuller is the Managing Director of Fuller Asset Management, a Registered Investment Adviser. This post is for informational purposes only. There are risks involved with investing including loss of principal. Lawrence Fuller makes no explicit or implicit guarantee with respect to performance or the outcome of any investment or projections made by him or Fuller Asset Management. There is no guarantee that the goals of the strategies discussed by will be met. Information or opinions expressed may change without notice, and should not be considered recommendations to buy or sell any particular security.


